

OFF THE SHELF: JULY 2026
OXFORD TOOL MAPS FUTURE COVID-19 HOTSPOTS

move to carousel movement controls
 Pause slideshow
move to carousel content
Pause slideshow
move to carousel content

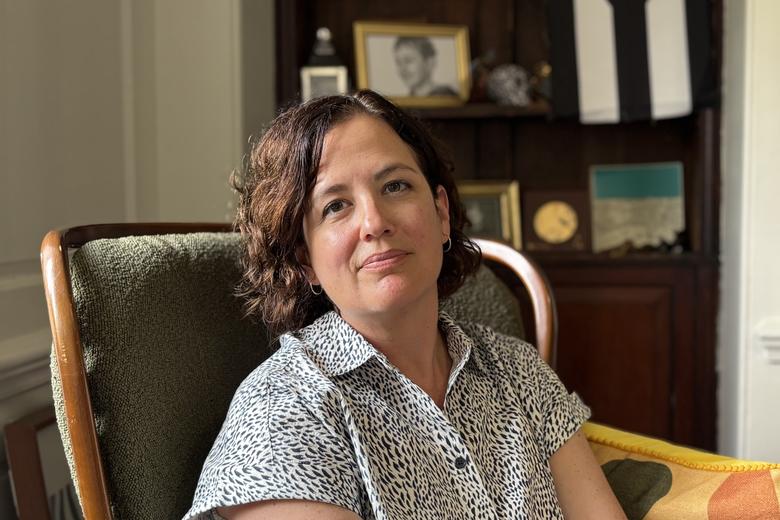
MALACHI MCINTOSH
MALACHI MCINTOSH
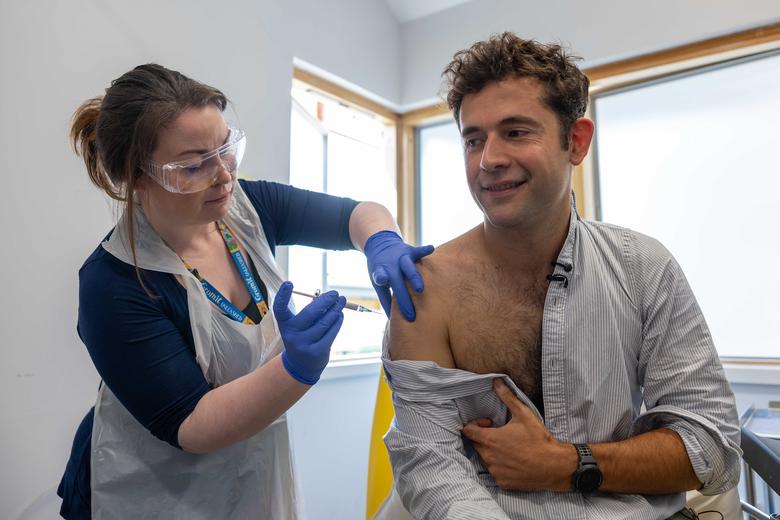
EBOLA: FIRST VACCINATION
EBOLA: FIRST VACCINATION
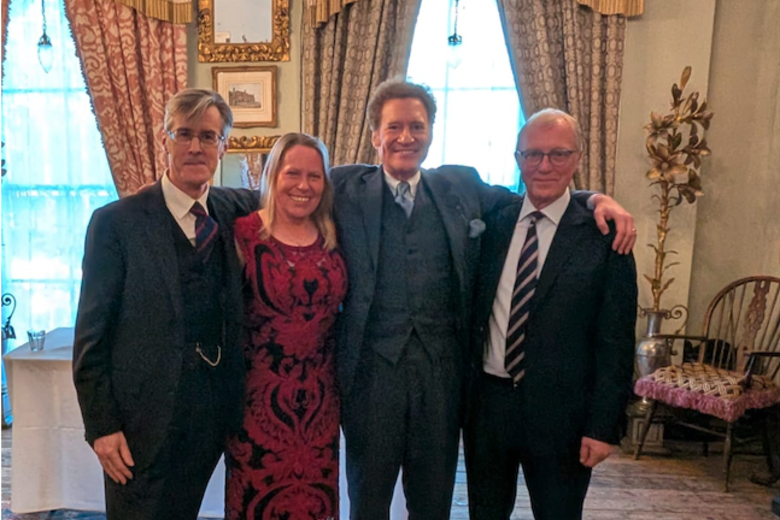
GRAPPLING WITH THE GHOSTS OF CARIBBEAN COLONIALISM
GRAPPLING WITH THE GHOSTS OF CARIBBEAN COLONIALISM

ADAM SMITH
ADAM SMITH
CONSERVATION AND WAR STUDIES JOIN HANDS
CONSERVATION AND WAR STUDIES JOIN HANDS

YOUR SUMMER GUIDE TO OXFORD
YOUR SUMMER GUIDE TO OXFORD

OFF THE SHELF: JUNE 2026
OFF THE SHELF: JUNE 2026

EBOLA: WE NEED MORE THAN A VACCINE
EBOLA: WE NEED MORE THAN A VACCINE

30 YEARS OF THE THAMES PATH
30 YEARS OF THE THAMES PATH

ANOTHER WORLD
ANOTHER WORLD

SATIRE COMES TO THE SHELDONIAN